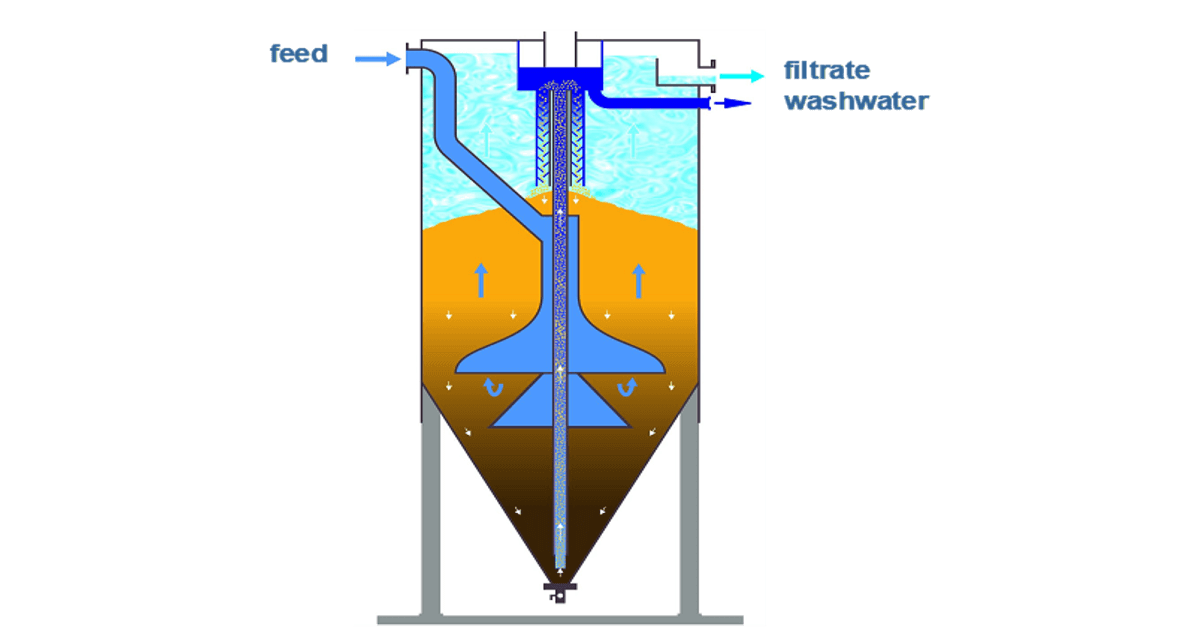
A continuous sand filtration process is enabled by the continuous process of abstraction at the bottom of the filter, vertical media transport (via the airlift) and media washing. As a result the sand grains in the filter bed are moving downwards at a typical speed between 3 and 16 mm per minute. We call this movement the sand circulation rate. This is what makes the continuous filter differ from a batchwise washed sand filter.
The sand circulation rate appears to be of great importance for the filtration efficiency. Two phenomena have to be understood in this respect:
- A lower sand circulation rate implies that it takes longer for the filter material to travel from the top to the bottom. The turnover time is defined as the time between two passages of the washing system. E.g. if the sand circulation rate is 10 mm per minute and the filter bed height is 2 meter the turnover time is 3 hours and twenty minutes. The lower the sand circulation rate the higher the turnover time. As a result It means that solids will infiltrate deeper into the filter bed. The amount of solids present in the pores of the filter bed will increase. The filtering mechanism will improve as “dirt catches dirt”.
- Filter grains moving downwards in a continuous filter tend to rotate, as has been discovered by live endoscopic recordings inside the filter bed. This rotating movement component will release part of the solids which was already captured in the pore space. This phenomenon is more pronounced at higher sand circulation rates. Consequentially the filtrate quality is negatively influenced at higher sand circulation rates.
Field research using feed water with a very low solids concentration and low in turbidity was executed to confirm this mechanism. In figure 1 continuous filter performance data are collected using feed water from a surface water reservoir, low in solids and turbidity. The filter media used is filter sand in a gradient of 0.8 – 1.25 mm. The filter bed height is 2 meters and the filter is operated at a filtration rate of 8 m/h.
The figure plots sand circulation rate against filter performance for two operating cases:
- the red line shows the results of plain filtration, without adding a coagulant;
- the blue line shows the results of filtration enhanced by a coagulant dosage of 4 mg/l iron in the feed to the filter.
In both cases the impact is clearly visible, although the impact is less pronounced in case of a coagulant dosing.
One final important remark should be made: never apply a sand circulation rate which is lower than the minimum applicable rate. The sand circulation should be high enough to balance the solids coming in with the feed water with the solids washed out with the wash water.
If the sand circulation rate is chosen too low, this balance will not be reached and as a result the filter bed resistance will start to raise. This will finally lead to a breakthrough of solids in the filtrate.
To summarize: optimizing sand circulation rate will help you achieve higher filter performances, as illustrated in the field experiments. How this mechanism can be converted into a practical control tool which is applicable in a wide range of operating conditions will be discussed in one of the future blog posts.
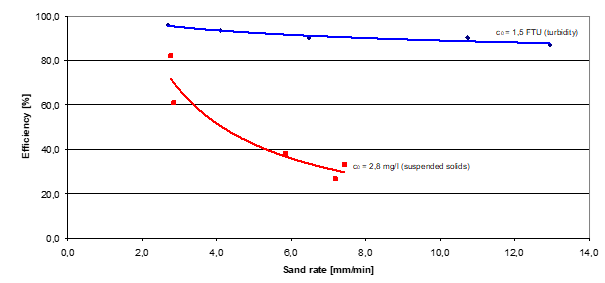
Figure 1. – Plot of sand circulation rate versus filter performance