Introduction
Tightening effluent consents due to river water quality drivers require further investment for improved removal of nitrogen and phosphorus from Wastewater Treatment Plants (WwTP). As a result, tertiary treatment processes have become increasingly important. This has led to a need to gain a better understanding of the process and mechanics of tertiary removal systems in order to remain both compliant now, and for the future lowering of effluent discharge limits. Efforts have been successfully made to upgrade and refurbish existing tertiary continuous sand filters using the novel Sand-Cycle technology. It has given rise to a better understanding of the relationship between sand circulation and filtration efficiencies. Real-time information acts as an early warning system to consistently meet better effluent qualities through faster reactive measures, as well as proactive analysis of data.
Phosphorus removal in existing treatment plants
Meeting annual rolling average total-P levels of 0.25 – 0.50 mg/l may require a primary, secondary and/or tertiary dosing of coagulant. Tertiary sand filtration with inline flow controlled coagulant dosing has proven effective to minimize coagulant dosage and meet residual Fe concentration limits (Wouters, 2018).
80% of DCWW sites are small WwTPs: capacities below 2,000 population equivalent. It is a challenge to manage these plants across a wide and varied geographical area. Additionally, these existing assets are challenged to meet more stringent effluent targets. With operational staff numbers reduced and more process complexity in the treatment process, this paradigm requires a significant shift in monitoring and control strategies. Remote sensing, expert judgement, and big data analytics are key to support asset optimization. This is illustrated for two recently upgraded tertiary continuous filter plants within DCWW.
Monitoring and control of continuous sand filters
Continuous sand filtration, with uninterrupted filtration and continuous media washing, is widely applied in water and wastewater treatment. Various types and makes of continuous filters are used for tertiary treatment of municipal wastewater. Key features are the homogeneous sand circulation over the full filter area and the simultaneous continuous sand washing.
The actual sand circulation rate affects the filtration efficiency for both solids removal and biological conversion. Real time monitoring and control of sand circulation rates is therefore crucial to optimize plant performance and reduce down-time.
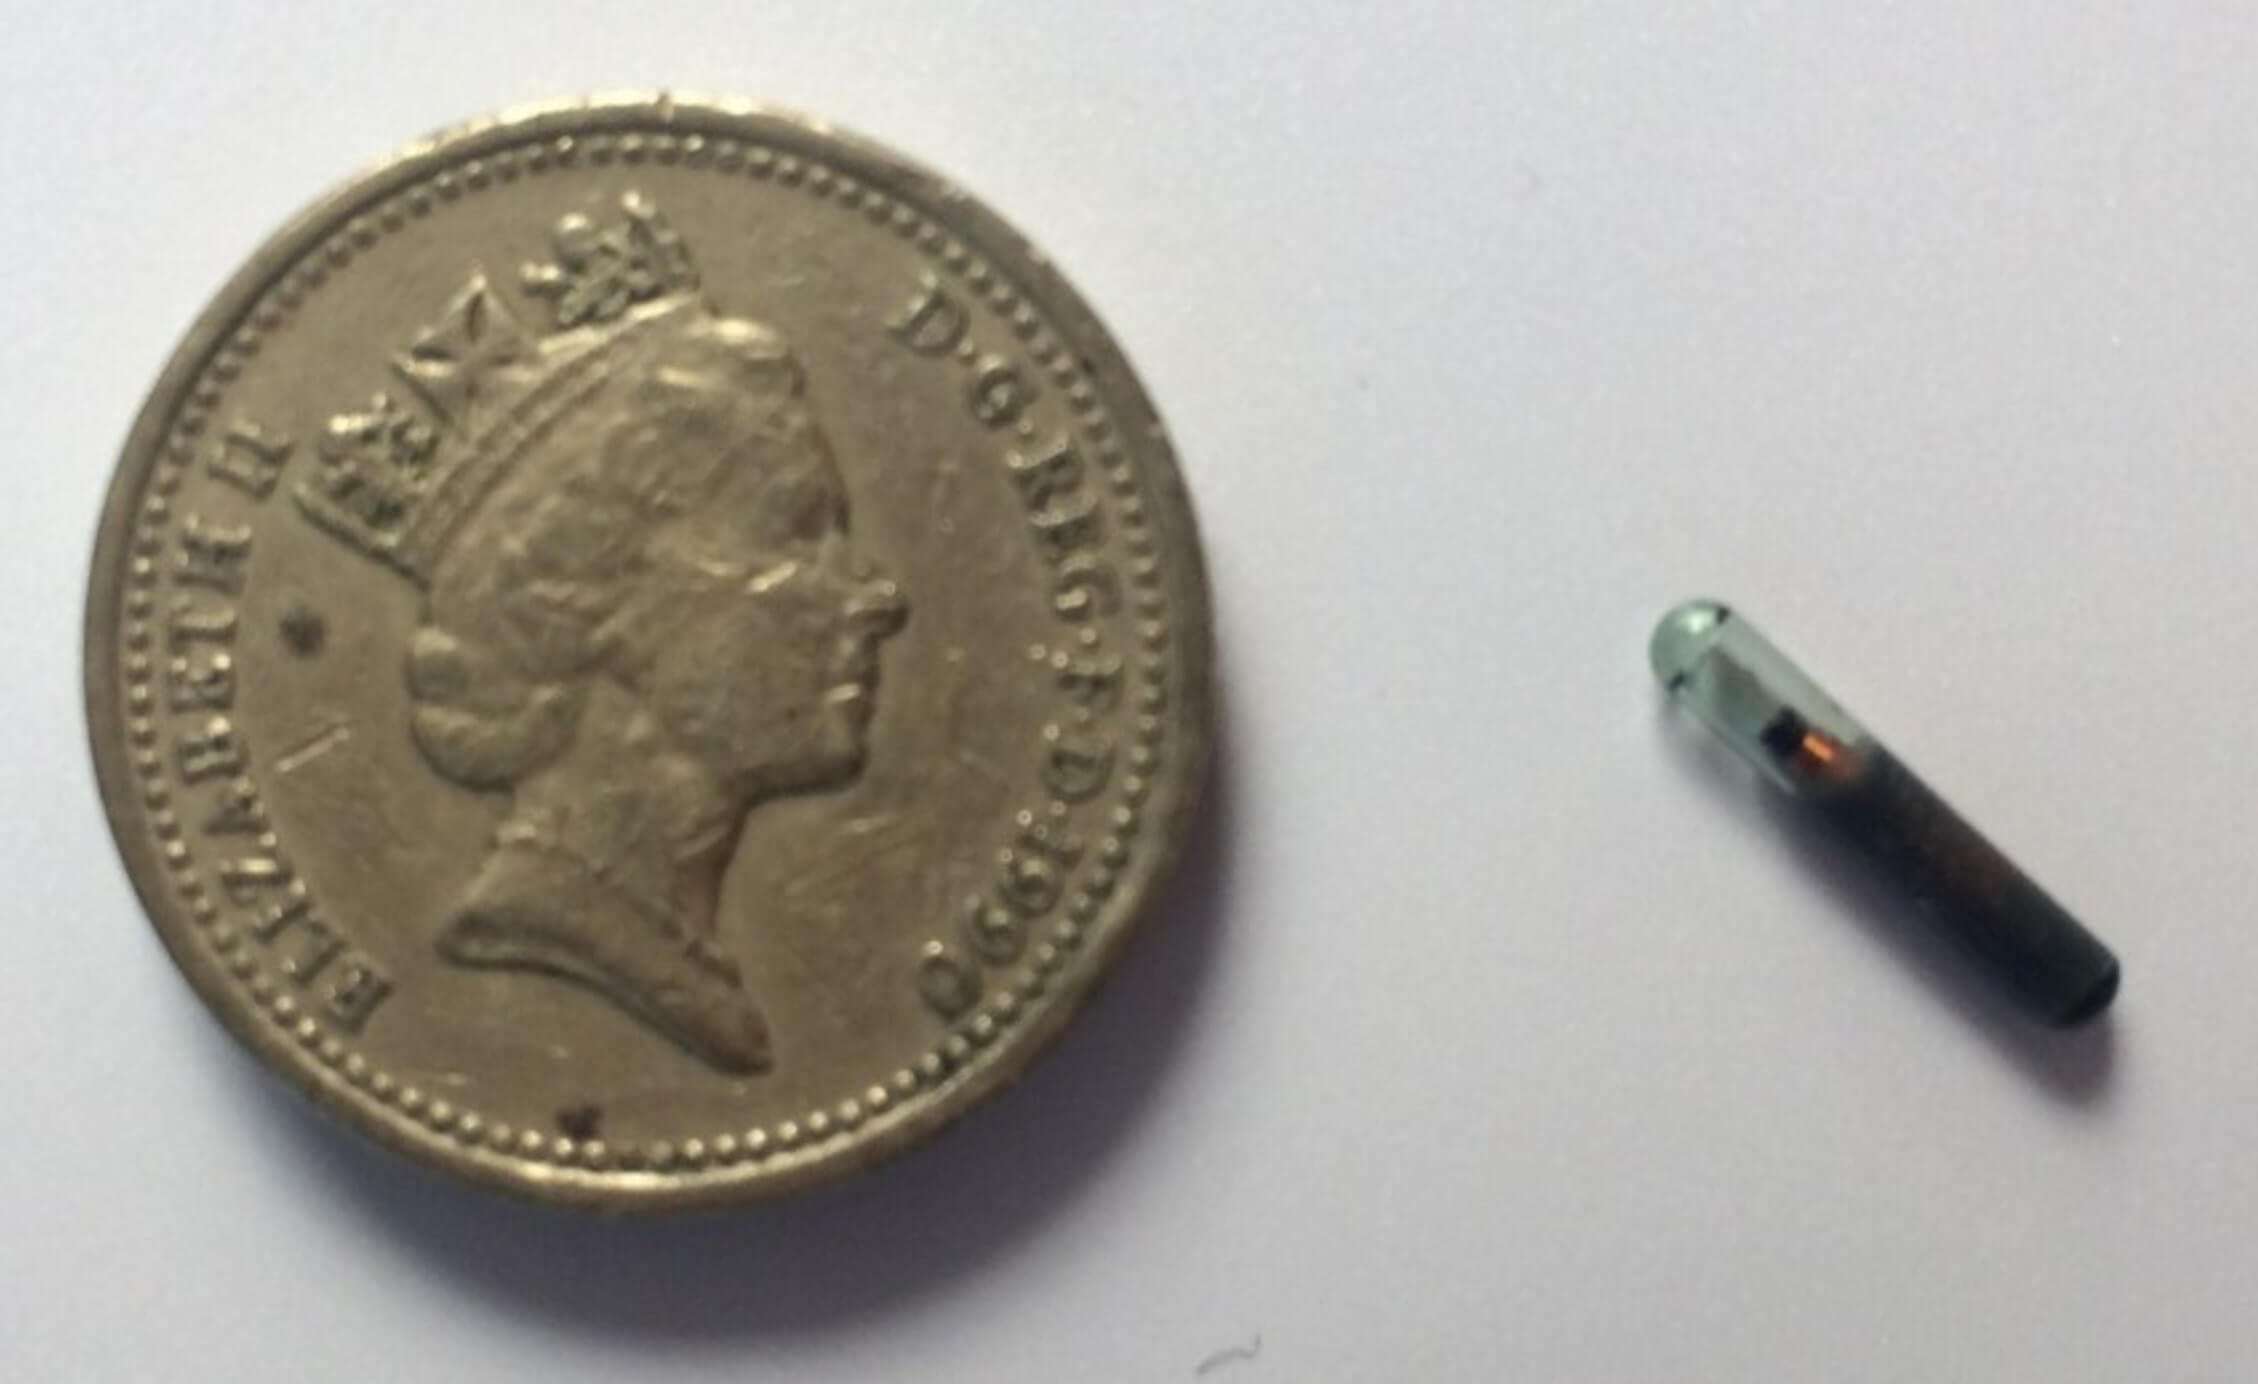
Figure 1: RFID tag displayed
To monitor the movement of sand grains passive RFID tags are applied (Figure 1). RFID tagging is an ID system that uses small radio frequency identification devices for identification and tracking purposes. It includes the tag itself (transponder), a reader and a host system application for data collection, logging, processing, and transmission. The RFID tag is briefly activated by the radio frequency scan of the reader.
Each transponder has a unique code, which cannot be duplicated. Although RFID tagging is used in many applications, such as tracking wildlife and livestock, the use in the water industry is new, creating powerful opportunities in a fluidic environment.
Each transponder is detected while passing the reader, which is integrated in the airlift of the sand filter. The codes, dates and times of the passing transponders are transmitted via a decoder onto the datalogger, transmitting the data to the back end of the online data server. This server is converting the raw field data into relevant output data, using dedicated algorithms. Output is available for the operators 24/7 via the data server front office, presented in dashboards.
Full scale value
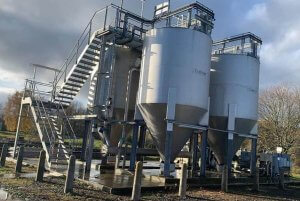
In 2020 two DCWW tertiary filter plants have been equipped with Sand-Cycle. At Whitchurch four continuous filters (make Colloide, figure 2) have been installed with Sand-Cycle following a successful innovation trial on a single filter in 2018, after which a focused refurbishment took place. From September 2020 onwards all units are operating consistently, meeting effluent targets without interventions.

Figure 2: Tertiary filter plant at Whitchurch WwTP
At Llanddewi Brefi WwTP a single continuous filter has been taken in operation mid-2020, to meet the effluent criteria for iron, solids and phosphorus. The dashboards are showing stable operations under varying process conditions. Any offsets, e.g. an interrupted air supply, causing the sand circulation rate to drop, is immediately picked up and reported to the operator (figure 3). Hence adequate actions can be taken.
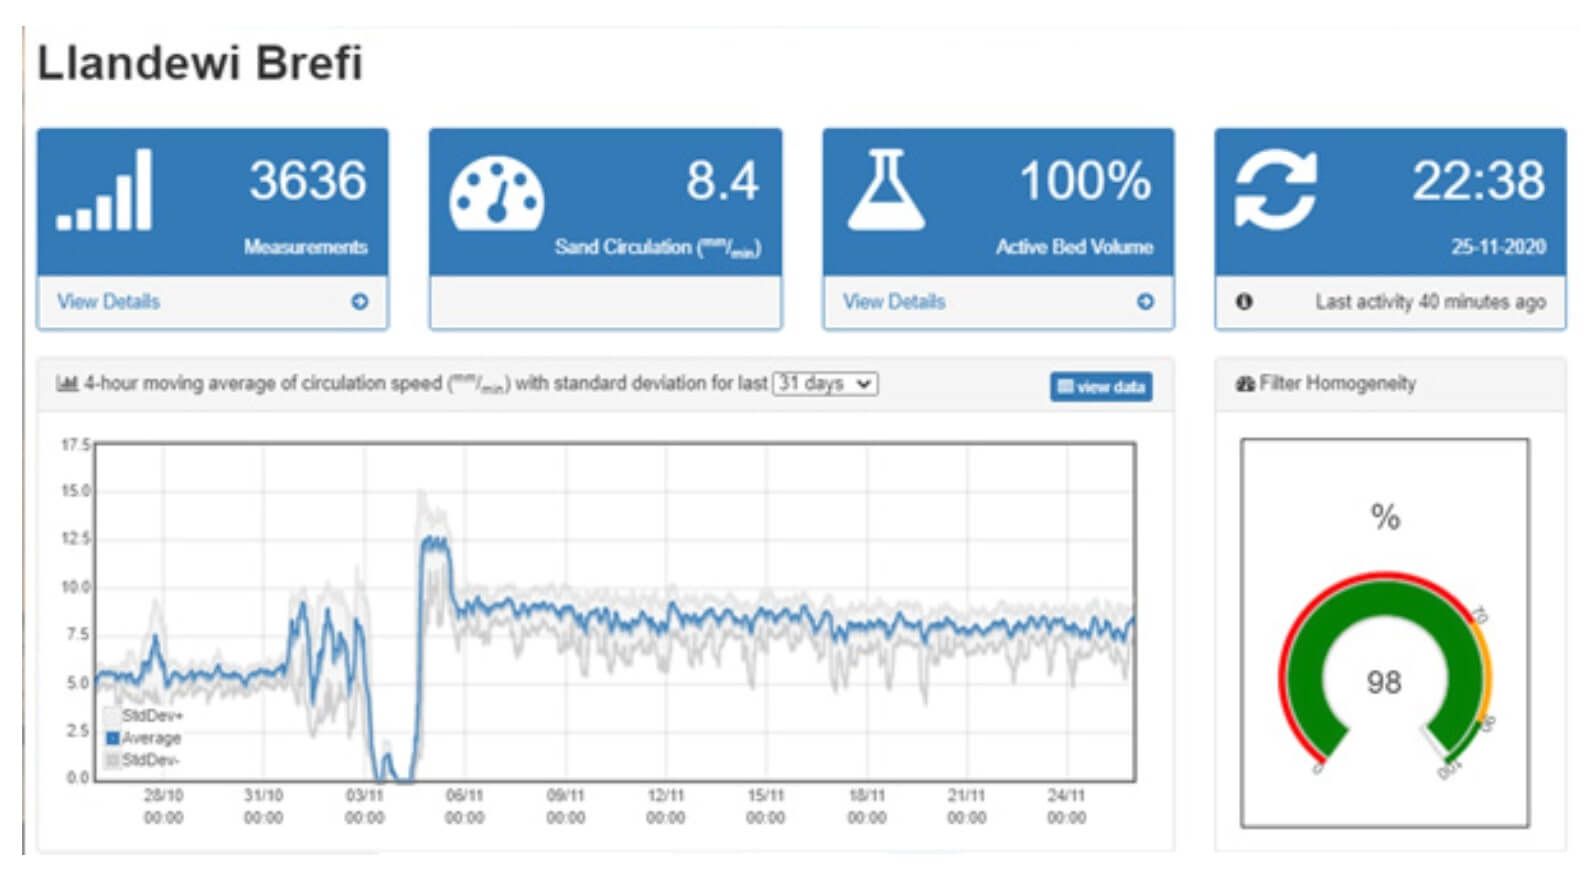
Figure 3: Sand-Cycle dashboard (Llanddewi Brefi WwTP)
Boosting filtration performance
Continuous sand filters are often operated in non-optimal conditions, and hence its potential is not fully utilised. The key factor is the applied sand circulation rate. If the rate is too high the filter bed is in a “clean” status, similar to starting a conventional rapid gravity sand filter directly after a back wash. To use the full potential the pores should be partly filled with solids to enhance the filtration mechanism. In a continuous filter this is managed by controlling the air flow to the airlift, which determines the actual sand circulation rate.
This is illustrated in Figure 4. The left-hand diagram shows high sand cycle rates, corresponding with a bed turnover of 6 hours in average, causing the filter bed to be consistently too clean. In this operation mode no “solids” build-up is achieved in the filter bed. The right-hand diagram shows lower sand cycle rates (with a higher bed turnover of 10 hours in average), adjusted to obtain optimal filter efficiencies. Now, the build-up of solids in the filter bed is assisting solids removal. Hence higher filtration efficiencies and/or lower consent levels are achieved.
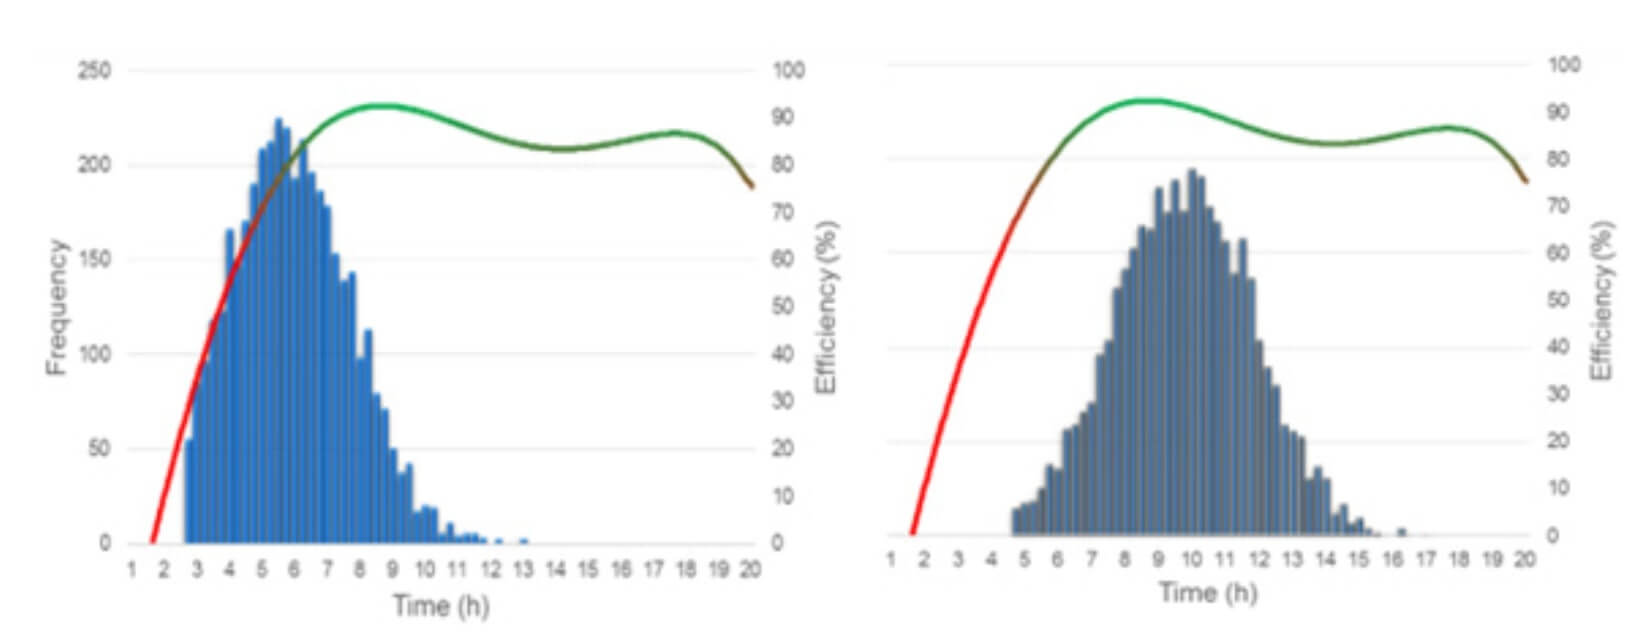
Figure 4: Impact of sand circulation time on filter performance
The combination of real time monitoring sand circulation rates and controlling the air flow to establish the best possible filter performance has proven to be a powerful tool to stretch the operating window of continuous sand filters and gain the highest possible removal efficiencies.
References
1 Wouters, J.W &. Agema. K.J, 2018. RFID technology as cost-effective real-time process monitoring and control tool in continuous sand filters: two case studies, the Netherlands: RFID technology as cost-effective real-time process monitoring and control tool in continuous sand filters: two case studies’ HIC 2018 – Palermo
2 Rathnaweera, S.S.; Rusten, B.; Manamperuma, L.D.; Gjevre, J.; Tranum, I., Evaluation of moving bed sand filter for denitrification, suspended solids removal and very low effluent total phosphorus concentrations, Water Science & Technology, 2019, p 232-242