Towards an extensive P removal scheme with tertiary moving bed filtration

Abstract
The popular theme park Efteling in Kaatsheuvel (the Netherlands) launched a drought prevention program to reduce the total volume of ground water abstraction to feed the numerous water ponds in the park. The ponds, water bodies and fountains are vital components for both the theme park and the adjacent golf course. Moreover the water is used for green keeping. Groundwater was used for green keeping, but as a result groundwater levels tended to drop. Therefore effluent from WWTP Kaatsheuvel has been used for replenishing water in the ponds since 1997. Particular attention was paid to extensive removal of phosphorus to levels below 0.10 mg/l total P to prevent any eutrophication in the ponds.
Drivers for P removal
Algae blooming in open surface water bodies are causing serious problems: excess growth will affect oxygen levels, light intrusion and may lead to release of toxic components. Therefore sensitive surface waters should be protected against high concentrations of P. Targets as low as 0.10 – 0.15 mg/l P are set for some receiving surface waters to prevent algae blooms from growing. As a result waste water treatment works effluent, discharging into these waters often require further treatment to achieve low P levels.
P-removal for waste water reuse
The popular theme park Efteling in Kaatsheuvel (the Netherlands) launched a drought prevention program to reduce the total volume of ground water abstraction to feed the numerous water ponds in the park. The ponds, water bodies and fountains are vital components for both the theme park and the adjacent golf course. Moreover the water is used for green keeping. Groundwater was used for green keeping, but as a result groundwater levels tended to drop. Therefore effluent from WWTP Kaatsheuvel has been used for replenishing water in the ponds since 1997.
To improve the bacteriological effluent quality and the nutrient levels the effluent was passed through reed bed filters before being reused. Four vertical flow reed bed filters with a total surface area of 8,000 m2 were constructed for a total capacity of 80 m3/h. Hence the infiltration rate is 10 l/(m2.h). The reed beds are fed intermittently and the treated effluent is fed to one of the water ponds at the Efteling golf course.
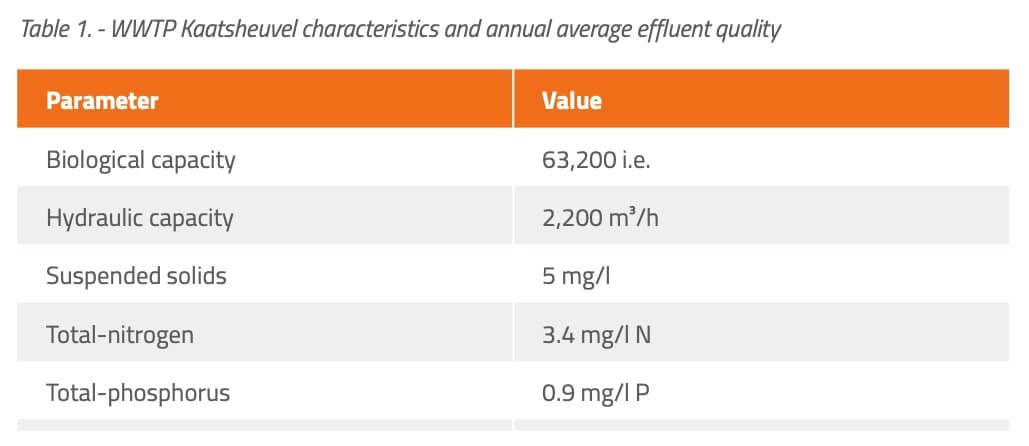
WWTP effluent characteristics are shown in table 1. Although the effluent quality of the plant is already excellent and the reed bed filters were able to reduce the P levels further to 0.5 mg/l, it did not prevent eutrophication in the ponds. Abundant blue algae blooms were reported in 1999, which appeared to be due to high phosphorus levels of up to 0.5 mg/l P in the reed bed effluent.
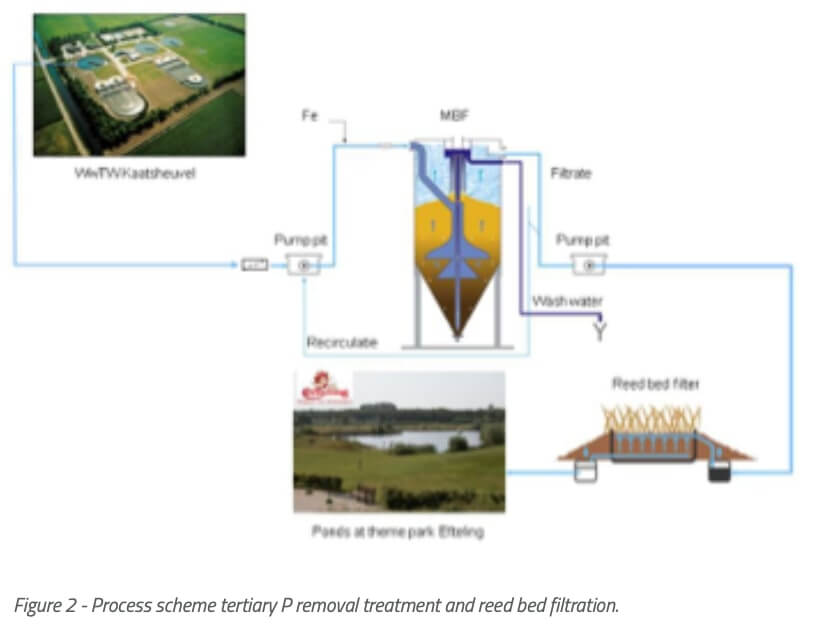
Further optimization of the reed beds proved to be difficult. Therefore it was decided to implement a tertiary treatment for phosphorus removal at the WWTP, before the treated water is fed into the reed beds. The core of the tertiary treatment comprised of moving bed filtration (MBF) (figure 1).

Secondary clarifier effluent is fed to the filter. FeClSO4 is dosed to the filter feed to remove P. With a dosage of approximately 4 mg/l Fe3+ the phosphorus level is reduced to < 0.1 mg/l P. As the feed P levels fluctuate only slightly, P proportional dosing was not implemented for simplicity of operation and therefore the dosage of Fe3+ is only flow proportional. The process scheme is indicated in figure 2.
The installed filter area is 8 m2 with a 1.8 m sand bed height, designed for a capacity of 80 m3/h. The filtrate is discharged to a pump pit from which it is transferred to the reed bed filters. Continuously generated wash water (4.5 m3/h) is recycled back to the head of the WwTW.
Sand-Cycle
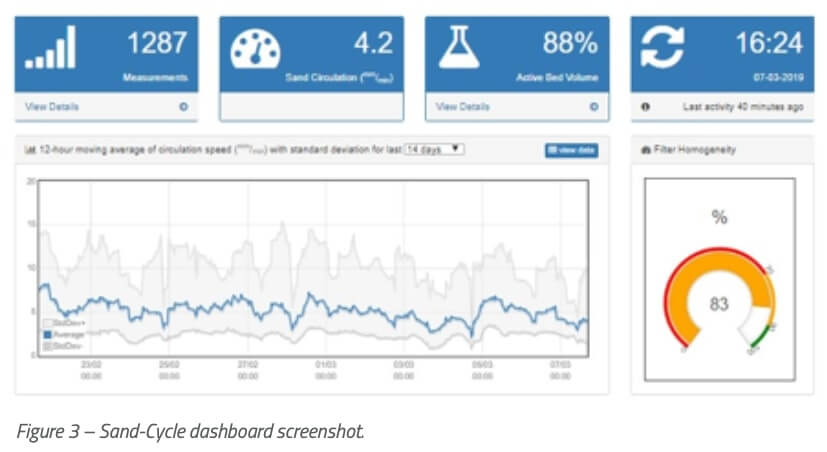
In 2017 the Sand-Cycle monitoring tool has been implemented to continuously monitor the sand movement in the filter, to detect any anomalies and/or sand loss.
The RFID tagging system forms the core of the Sand-Cycle setup and includes the tags (transponders), a reading device (the reader) and a host system application for data collection, logging, processing and transmission. The tags are generally attached to the object that needs to be identified but in this case they mimic sand grains and are mixed up together in the filter bed. They help in accounting of combined tag-sand grain circulation to monitor the filter operation. Each tag (transponder) has a unique code at the time of manufacture which cannot be duplicated or tampered with. This code facilitates unique and positive identification as the transponder pass through the reader. Each transponder is detected while passing through the reader, which is integrated in the airlift structure of an MBF. The reader inductively energizes and excites the transponder by means of a polarized low frequency electromagnetic field emitted through an antenna. It then receives and processes the code signal bounced back by the transponder. Transponder signal can be read irrespective of their orientation with respect to the reader, also underwater (or in other fluids) and can be used in all weather conditions.
The codes, dates and time stamp of the passing transponders are then transmitted to a decoder that collects data from multiple readers. The decoder is connected to a data logger, which stores data received from the decoder in readable formats. The data logger is equipped with a GPRS modem to transmit the data to the back end of online data server. The data server is converting the raw field data into relevant output data using dedicated algorithms and big data analysis. Output is available 24/7 for the operators via the server’s front office and is illustrated as digital dashboards. A screenshot of the dashboard for the Kaatsheuvel sand filter is indicated in figure 3.
Process results
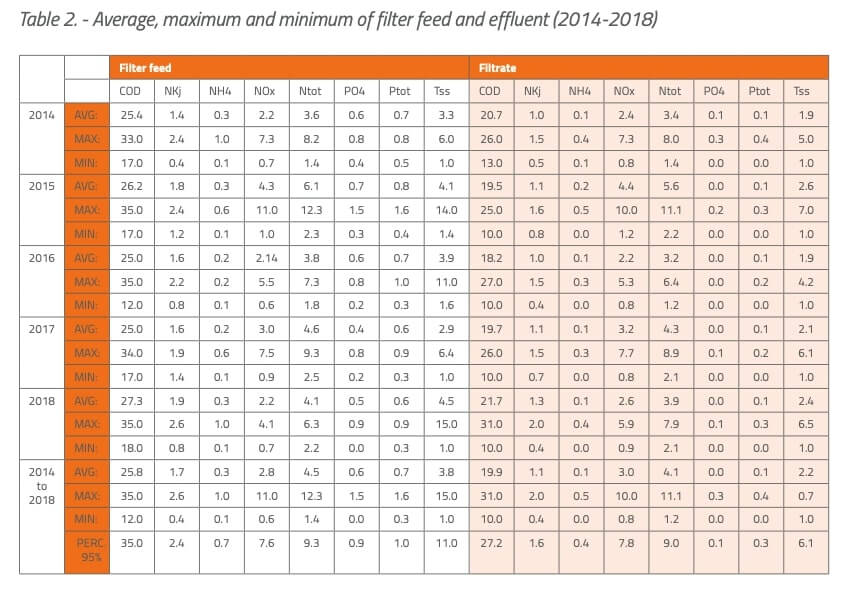
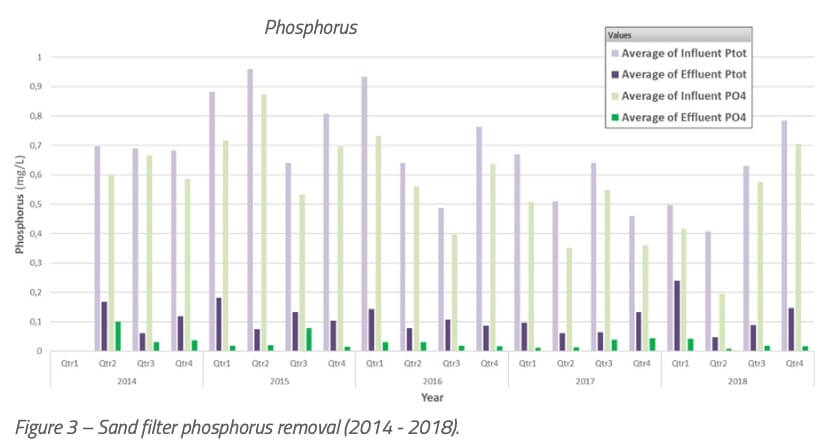
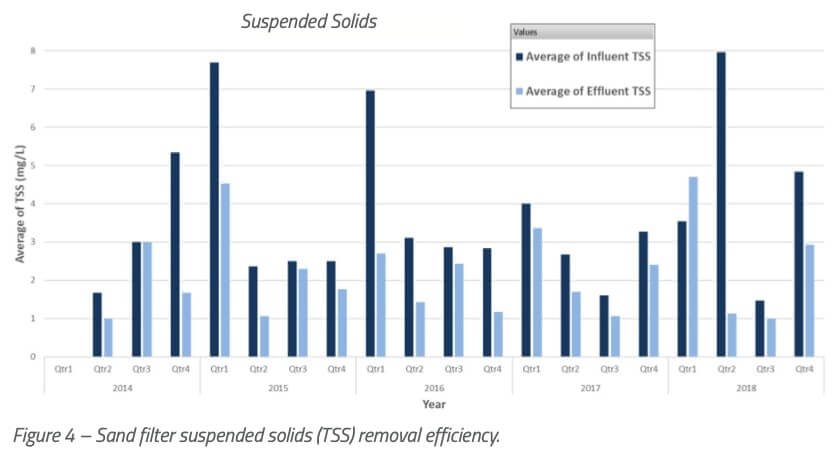
The sand filter plant was put into service in 2002. The results to date show excellent removal rates for ortho-P and total-P of about 90% on average. COD and TSS removal efficiencies are in the range of 15 – 20% and 40 – 50% respectively. An extensive overview of the feed and filtrate water quality data is summarized in table 2, for the period 2014 – 2018.
In figure 3 a graph is shown for P removal, both for total-P and soluble-P. Figure 4 indicates the net removal of TSS in the filter, based upon the TSS concentration in the filter feed prior to dosing. Due to dosing of ferric the feed solids concentration is approximately 8 mg/l higher.
After reed bed filtration the water meets swimming water bacteriological consent levels set by the EU. Visibility in the ponds has increased to values of over 60 cm. Ever since 2002 algae blooms were not observed any more.
Acknowledgement
The water quality data presented in this document are supplied by Waterschap Brabantse Delta. Their cooperation in exchanging the relevant information is highly appreciated.