Impurities present in the water will be captured in the pore space of the filter bed. Due to these deposits the pores become narrower, leading to additional filter bed resistance.
An important factor that influences filtration efficiency is the filling degree of the pores. A higher filling degree of the pores within the filter bed will act as an additional barrier for solids entering the filter. This will generally lead to a better filtrate quality. Also known as “dirt catching dirt”.
So, to improve filtration efficiency, a certain amount of deposits are necessary, which can be achieved by decreasing the sand circulation rate. The lower the applied sand circulation rate, the higher the amount of deposits, the higher the additional filter bed head loss, the higher the filtration efficiency.
This holds true until the maximum applicable head loss is achieved. As indicated in one of our earlier blogs this maximum head loss is defined as 2/3 times bed height.
Changing sand circulation rates in continuous filtration is executed by adjusting the air flow to the airlift. The Sand-Cycle monitoring and control of continuous filters has been developed to obtain precisely these favorable conditions. Sand circulation rates which allow the filter system to operate within a head loss range to meet the best performance conditions.
Field data illustration
In a continuous filter the majority of the deposition will be present at the feed side of the filter bed, just above the filter feed distribution system. This is illustrated in figure 1, presenting the XY-diagram of head loss and filter bed height. The filter (with 1.8 m bed height) is operated at a filtration rate of 14 m/h at a water temperature of 10 degrees C. The applied sand grain size distribution is 0.8 – 1.25 mm. The clean bed head loss equals 0.40 meter per meter of bed height.
Two distinct process conditions are illustrated: the blue line representing high sand circulation rates (12 mm/min), no deposits build-up and hence only hydraulic head loss. The red line showing low sand circulation rates (2 mm/min), with consequential build-up of deposits in the lower filter bed area, creating additional head loss by deposits.
Comparing the difference in filter performance for turbidity removal for these two operating conditions indicates the relevancy: the average performance increases with 15 – 40%. If the continuous filter is furthermore used as biofilter (e.g. for nitrogen removal) this optimization contributes to retaining more biomass within the filter, promoting the biological conversion.
Summary
Head loss is an important process parameter in continuous filtration. It consists of two components: the hydraulic head loss and the head loss due to deposits in the filter bed. The nature of the continuous filtration process allows you to actively adjust the head loss due to deposits in the filter bed. The air supply to the airlift actively controls this head loss component. This will generally lead to higher filter performances.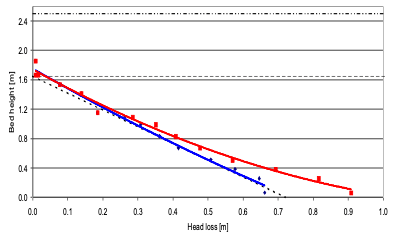
Figure 1 – Head loss versus bed height for two process conditions with distinct sand circulation rates in a continuous sand filter