
Sand-Cycle receives positive feedback in Norwegian pilot research
Sand-cycle receives positive feedback of researchers that have used Sand-Cycle in their pilot testing with continuous sand filtration at WwTW Gardermoen in Norway. They are enthusiastic about the use of this tool and reported their positive feedback.
International Water Association (IWA) publication
The research, executed on behalf of the Regional Research Council of the city of Oslo, focused upon nitrogen en phosphorus removal in a continuous sand filter after MBBR treatment. Very low effluent levels were consistently established; results have been published by IWA in the 80th Volume, Issue 2, of Water Science & Technology (see this link: https://doi.org/10.2166/wst.2019.266 to read the full article).
Robust and easy to use tool
The research team indicated Sand-Cycle to be a very convenient tool for monitoring good operating filter conditions. The results are reliable and, in addition, Sand-Cycle contributed to the quality and intensity of the research. Quick interventions were possible, once Sand-Cycle detected process anomalies, reducing valuable research off-time. These positive experiences with Sand-Cycle confirm what other users already have experienced. Sand-Cycle frequently receives positive feedback from other (inter)national references.
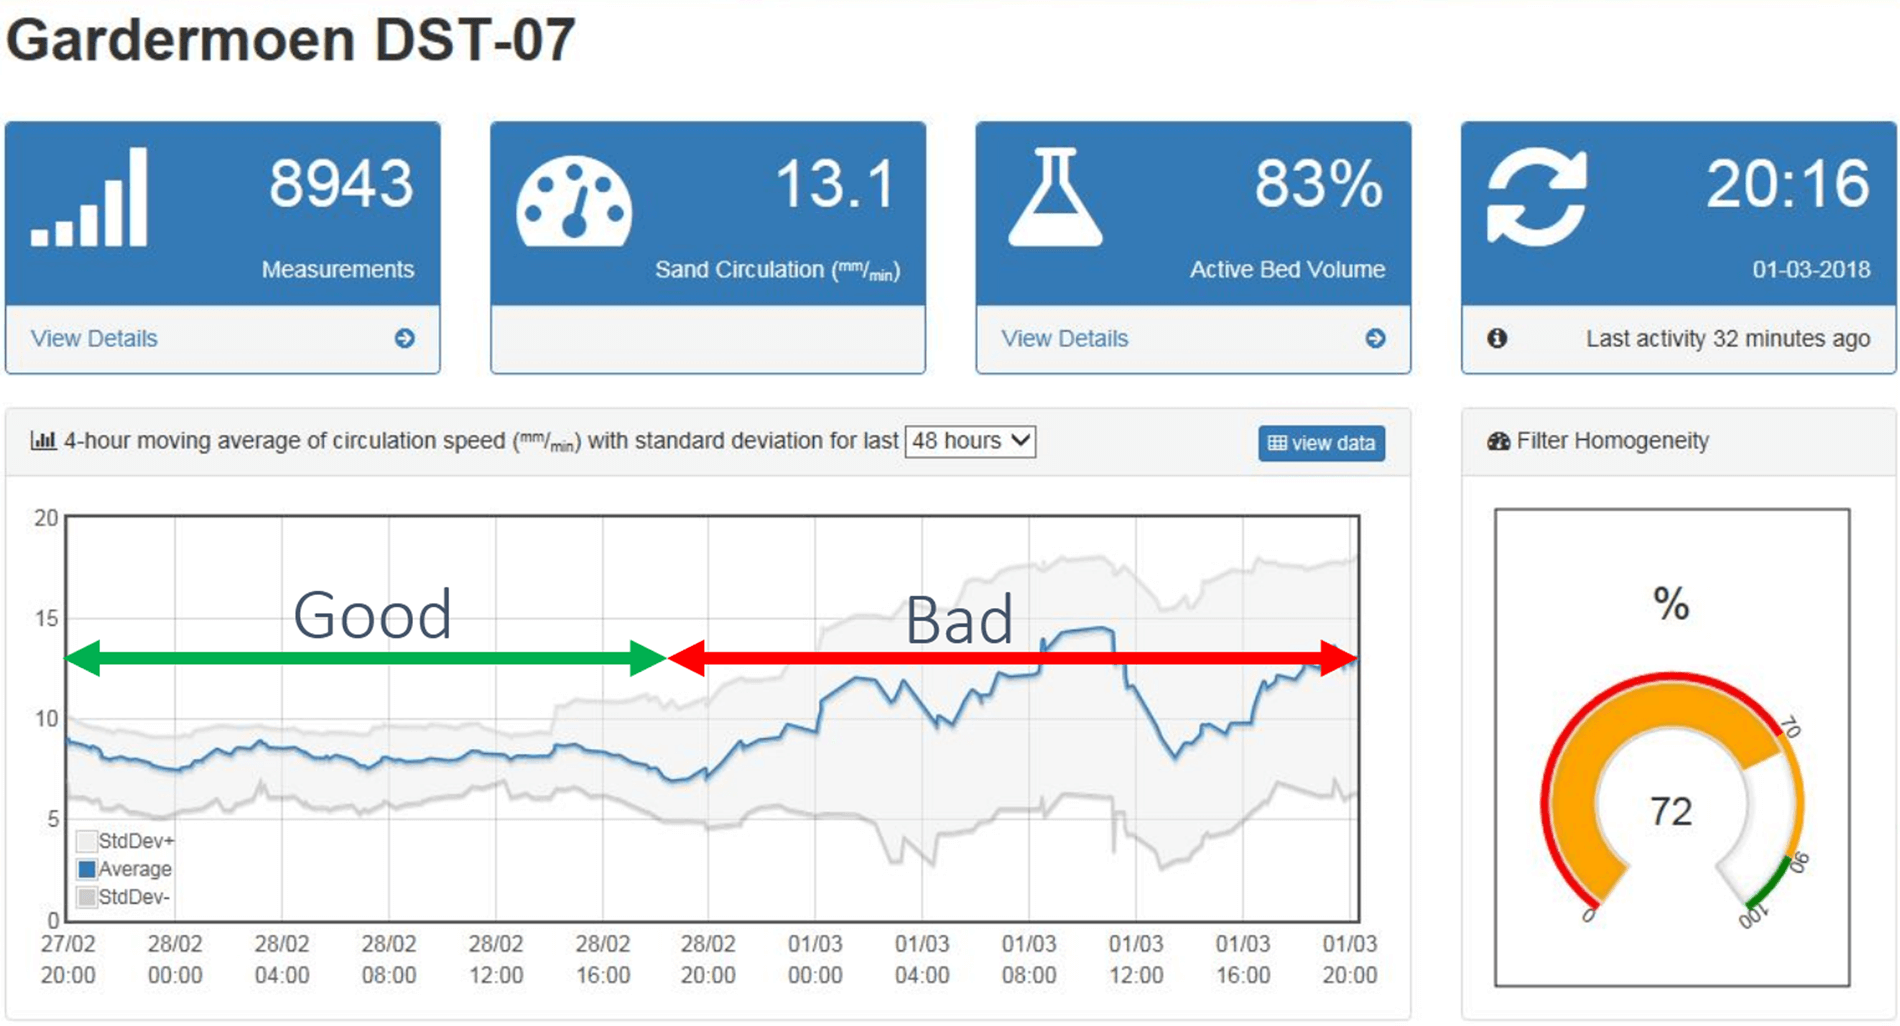
Sand-Cycle dashboard
The Sand-Cycle dashboard below clearly illustrates the recorded distinction between a good and bed performing filter. The scatter between the average and the standard deviation values indicates the homogenity level of the system. Greater spread (thicker band) implies that few parts of the filters flow significantly faster or slower. This case of thick band also depicts relatively lower performance level of the filter.